(Last updated on: May 20, 2019)
If you have a large venue and are selling tickets online, you should consider using an interactive graphic and breaking up your seating plan into multi-charts.
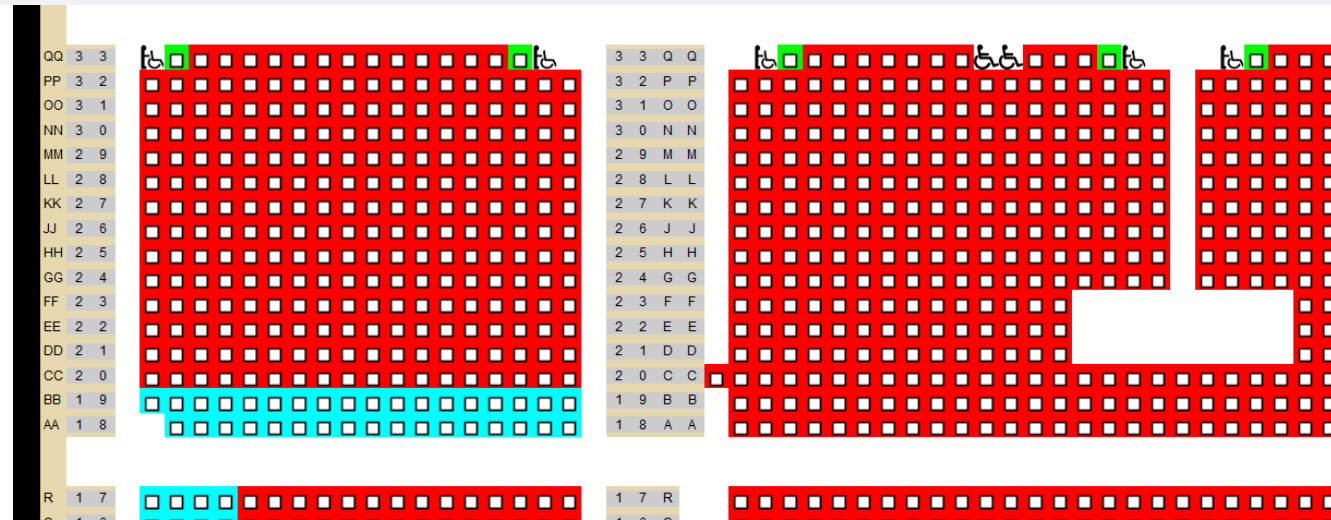
As you can see in the example below, if the seating chart is too big, online patrons have to scroll to find seats and can’t see the chart in its entirety.
NOTE: There are several steps that must be done correctly and precisely. We recommend that Center Stage Software build your multi-charts for a reasonable fee.
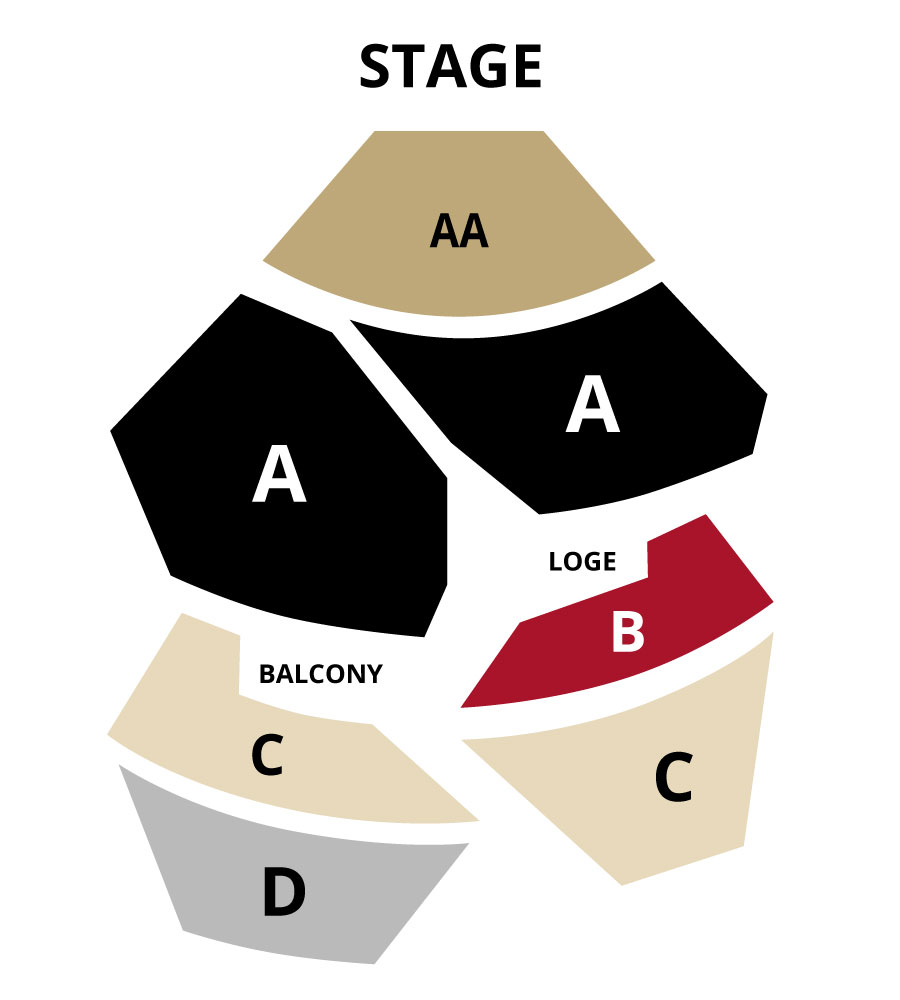
The first thing you need is a graphic.
- If you have a graphic designer on hand, have them create a simple graphic or we can create one for you for a reasonable fee.
- Store the image you created in the C:\Tix7\Graphics folder if you are using Wintix 5.
- Store the image you created in the C:\Wintix6\Graphics folder if you are using Wintix 6.
To map show graphic
- There are many image mappers available online but we like https://www.image-map.net/ You can use it for free.
- Select Poly in the Shape field.
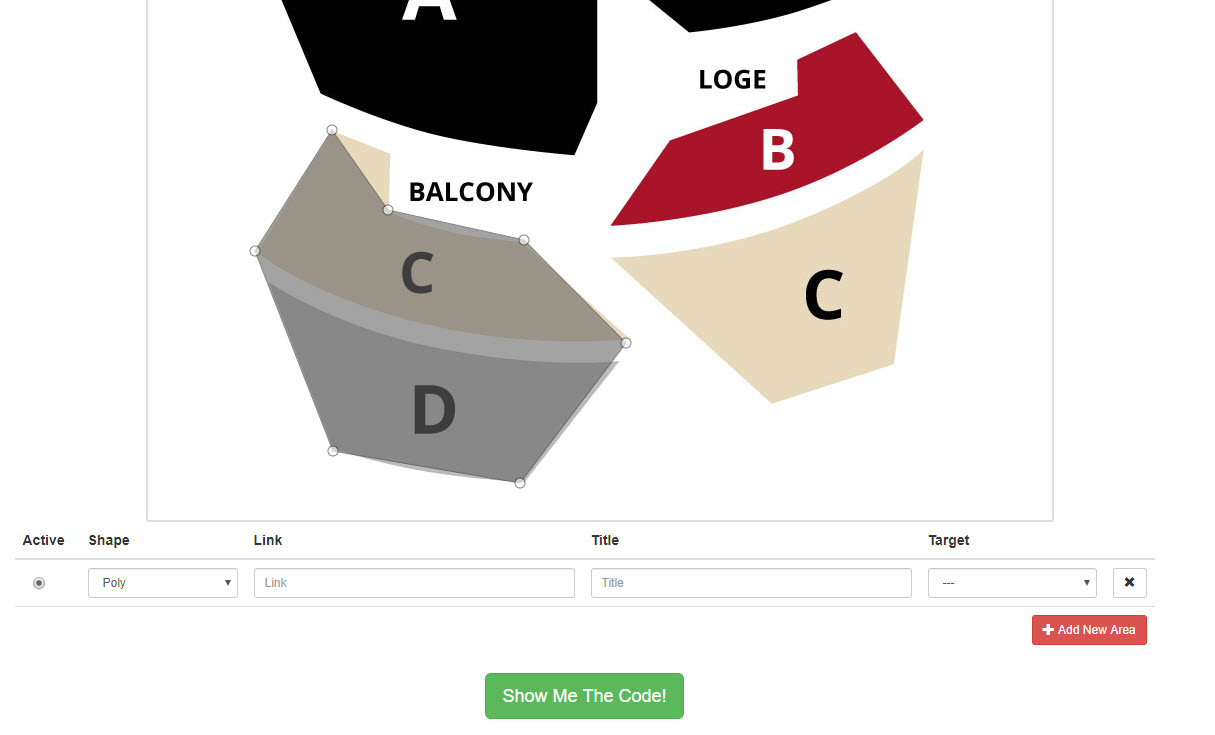
- Outline each shape that correlates to a seating plan by clicking around the edges until it is complete.
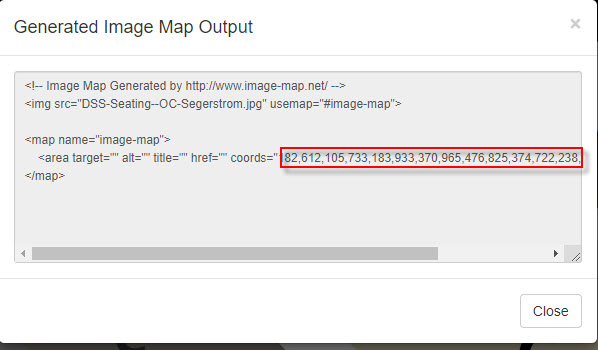
- Click the Show Me The Code! button.
- You may need to expand the window to see all the coordinates.
- The window may show you a red circle with a line through it when you try to copy the code. Ignore it. The numbers will still copy.
Enter map coordinates in the Wintix seating plans
- Copy and paste these coordinates into Wintix.
- Go to Tools | Seating plans and select the seating plan for this section that will be included in the multi-chart.
- Click the Settings tab and paste the coordinates in the Map coordinates box.
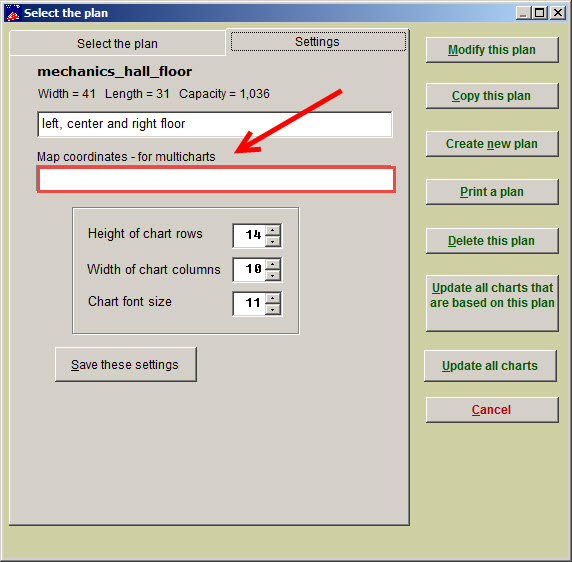
- Repeat for each seating plan.
Add the multiple charts to the show
- Go to Show | Edit a show | <name of show>
- Click on date of show and check the Use a seating plan box.
- Once that box is checked, the Use multiple charts box appears. Check it.
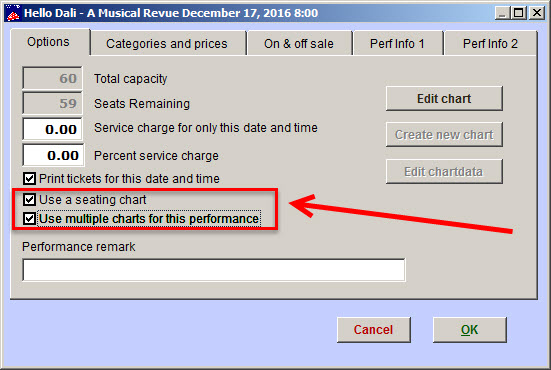
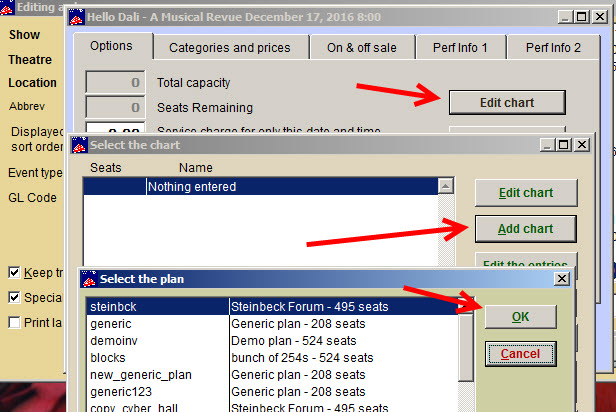
- Now click the Edit chart button.
- Then click Add chart.
- Continue until you have added all the charts and click OK.
Add the mapped image to the show
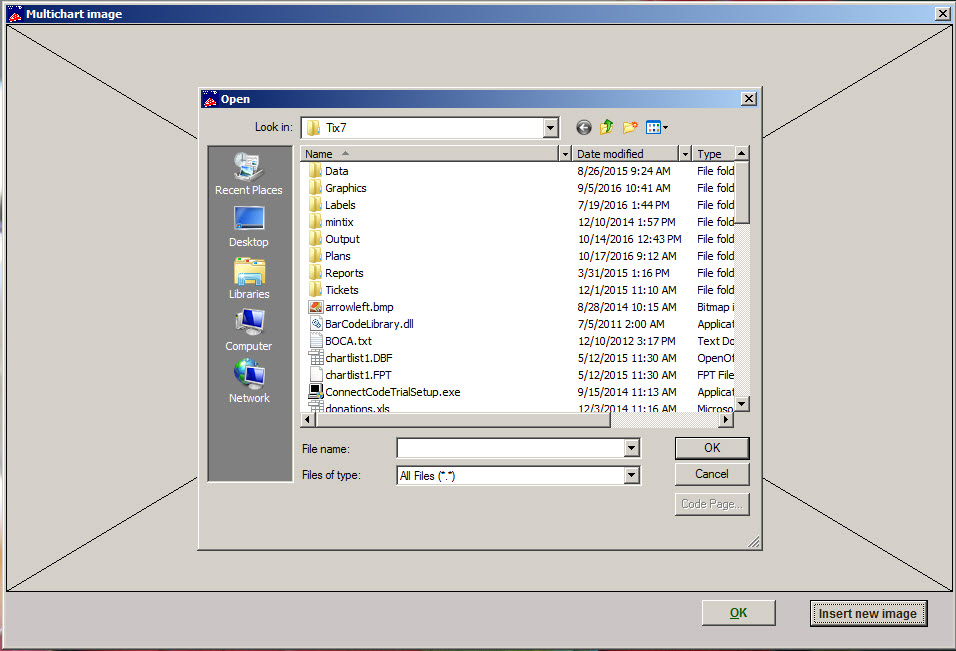
- Back at the Select the chart window, Click on the Image button, then click the Insert new image button.
- Browse to the image that is stored in the Tix 7/graphics folder. Click OK until you are back at the Edit the show window.
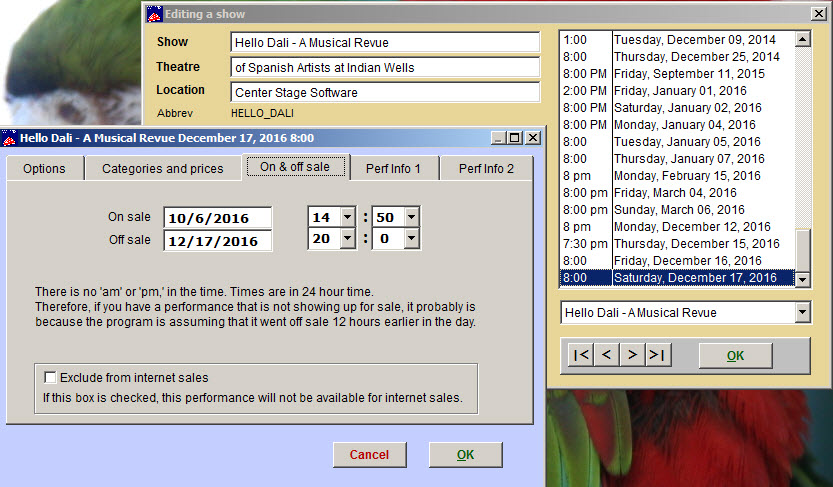
- Tab to On & off sale and make sure the box Exclude from internet sales is unchecked until you are ready to sell online.
- Make sure to check that box again if show is not ready to be online.