Skip to content
How to run a report that shows you who is sitting in what seats
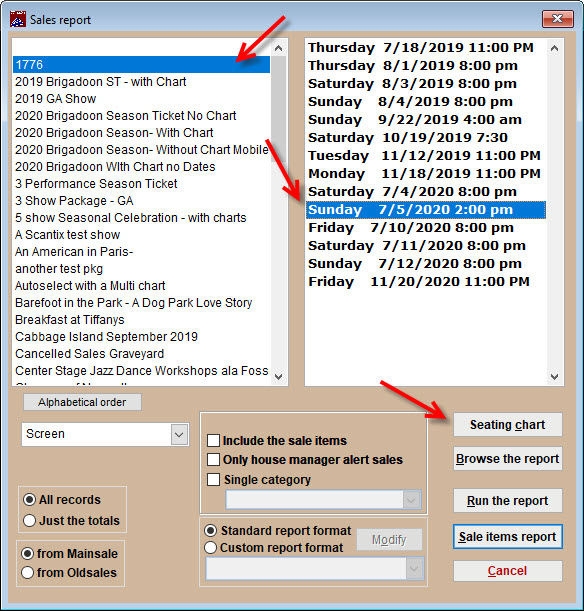
- Go to Reports | By show | Single performance
- Choose your show in the left column.
- Choose the performance date in the right column.
- Choose your output preference from the drop down on the bottom left.
- Click the Seating chart button.
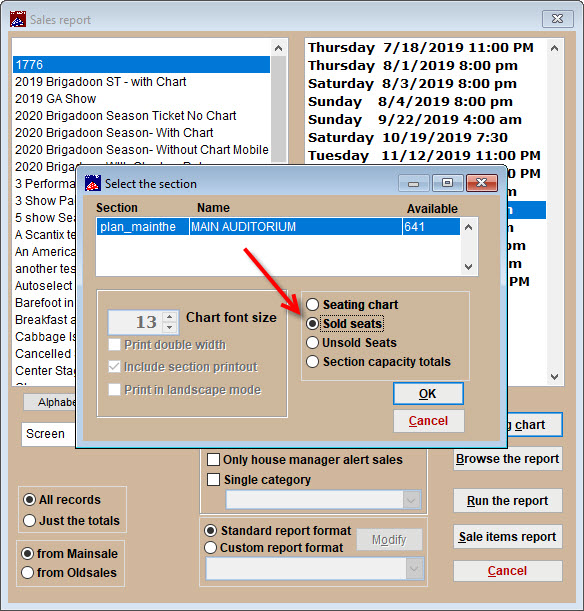
- When the Select the section window appears, select the Sold seats radio button.
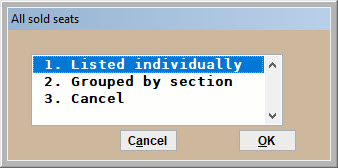
- Another window appears. You can choose to have a list of sold seats listed individually or grouped by section.
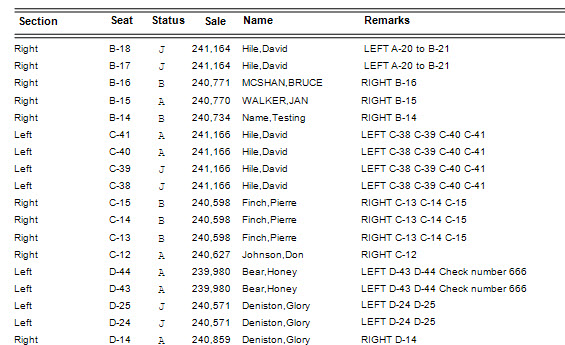
- This is what it looks like listed individually.