(Last updated on: May 11, 2017)
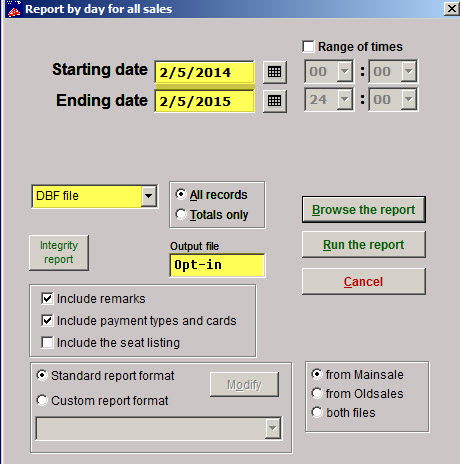
- Go to Reports | By Day | Sales report.
- Choose your starting and ending dates.
- Choose DBF file for the output type.
- Give the report a name in the Output file field.
- Click the Run the report button.
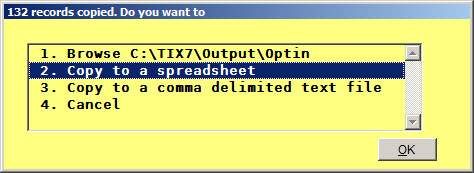
- A yellow box will appear, showing you how many records were found.
- You will have four options.
- Choose #2 – Copy to a spreadsheet.
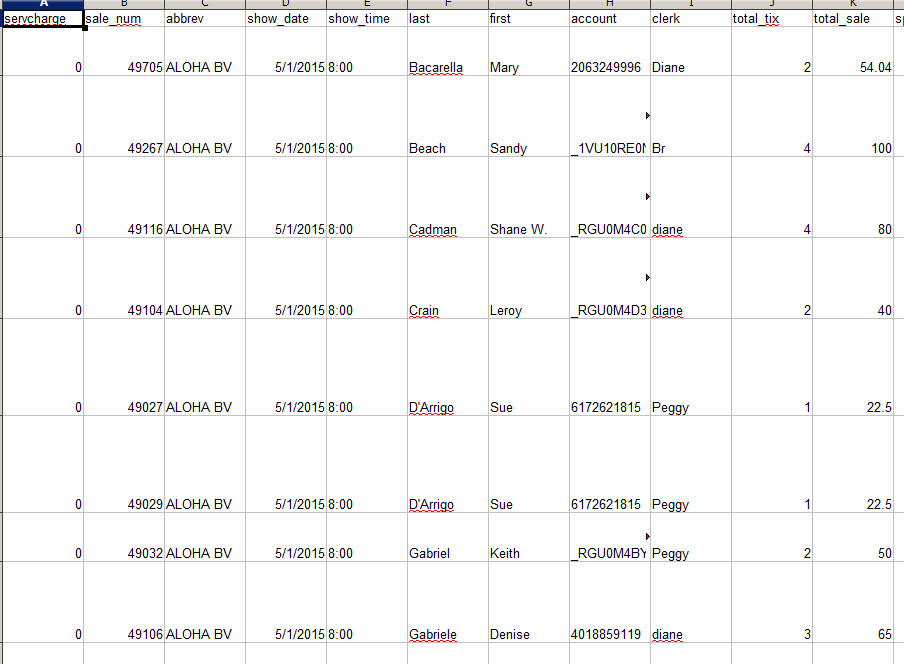
- You will then have a spreadsheet file that looks similar to this:
- Each column has a heading.
- Simply delete the columns you don’t have use for and keep the ones you do.
- There is a column for the entry date of the customer record.
- You can sort the spreadsheet by the entry date, then keep only those records that were entered recently.
- There is also a column for Opt-in.
- You can eliminate those records that did not Opt-in.
- That should leave you with only new customers who have opted in.
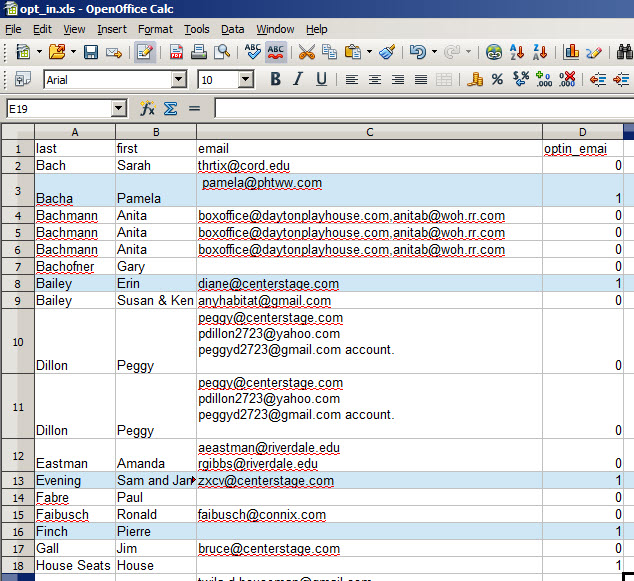
- The Opt-in email column has a zero for those who did NOT opt in and a 1 for those who DID opt in.
- The screenshot below is an example of what the report looks like once you start removing extra columns.


