This handy little report shows you historical sales totals for each year, month, or week month the theatre has been using Wintix. It also shows the percent changed over the time period chosen.
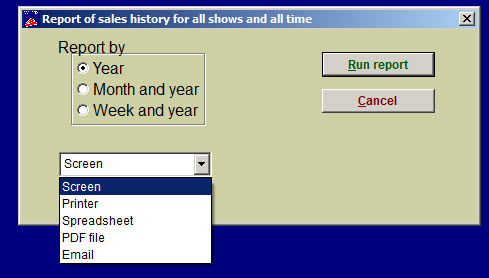
Go to Reports | Other reports | Historical report. You will see:
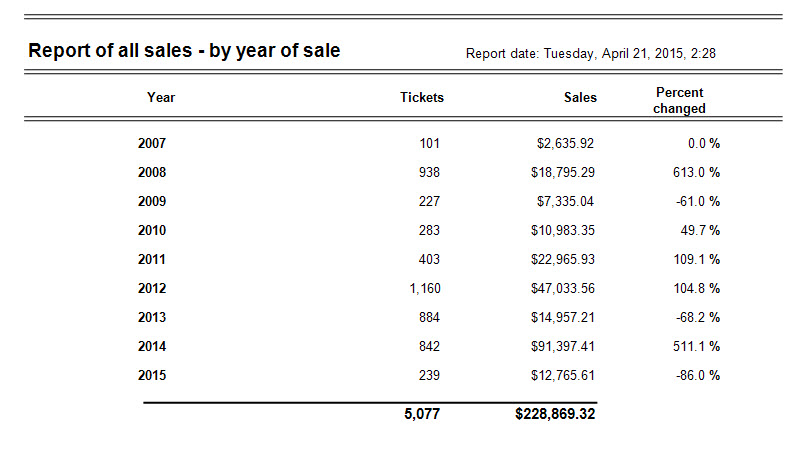
Here’s what it looks like when you run a Report by year:
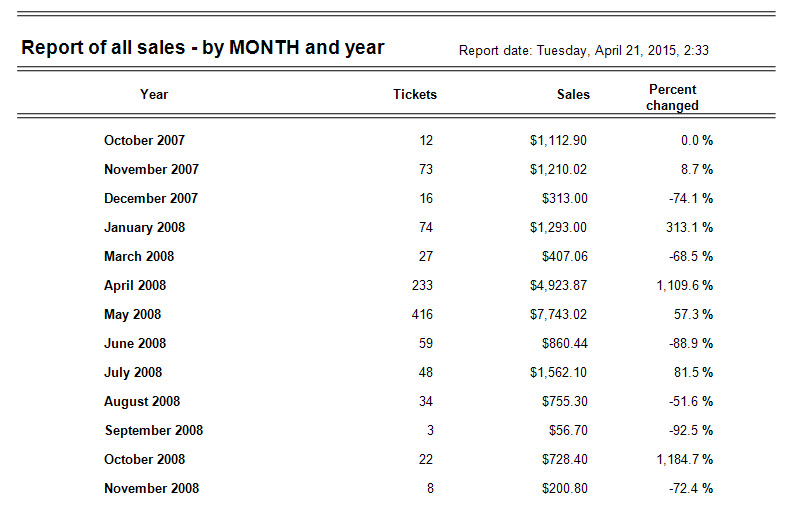
This is the Report by month and year:
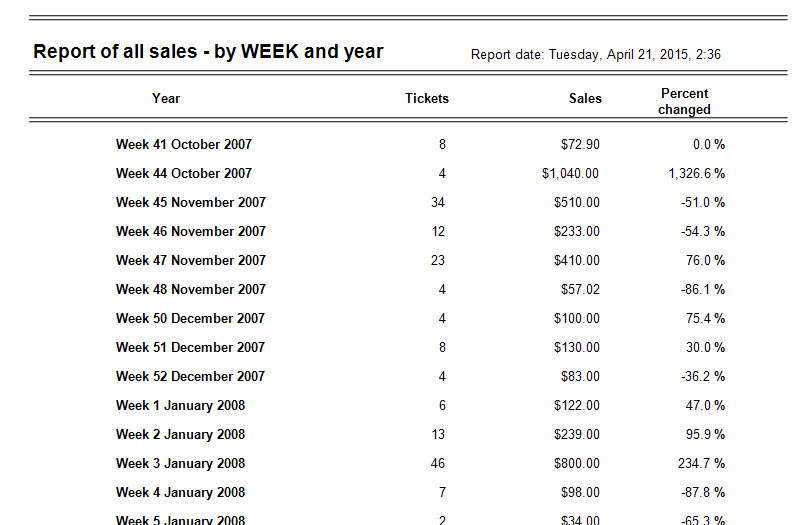
This the Report by week and year: